MACD


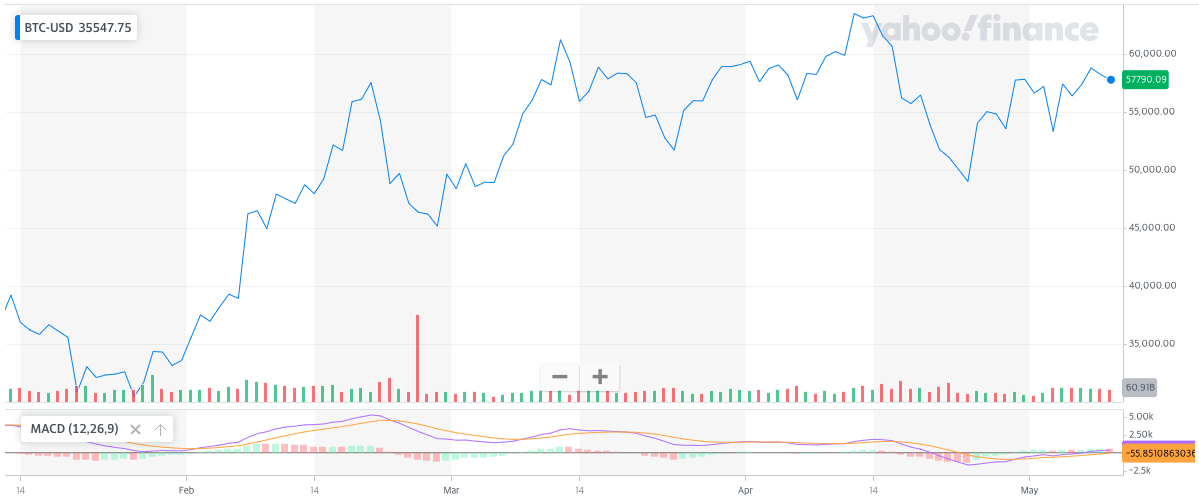
Now that you understand the moving average line, let's look at the MACD, an auxiliary indicator for reading stock price trends using the moving average line. MACD stands for Moving Average Convergence Divergence. It is a simple indicator that draws two moving average lines for a period and judges an uptrend when the short term moving average line appears above the long term moving average line.
The moving average is a value calculated from the average stock price from a certain point in the past to the present, so if you observe the stock price trend using the moving average, it will inevitably be delayed to some extent from the actual trend. So we can add a trick to overcome the weakness. When calculating the moving average, the exponential moving average (EMA) can be used, not the simple moving average (MA). The simple moving average is the most basic average value that everyone knows, and the exponential moving average is the average value calculated by giving a higher weight to the latest value. MACD uses exponential moving averages to help the indicator detect stock price trends even a little faster. The equation for obtaining the exponential moving average is as follows.
$EMA_{t}=\alpha p_{t} + (1-\alpha)EMA_{t-1}$
$\alpha=\frac{2}{N+1}$
$EMA_{t}: Exponential\ Moving\ Average\ at\ t$
$p_{t}: Price\ at\ t$
$N: Observation\ period$
It looks complicated, but it's not a difficult formula. Today's exponential moving average is the average of today's stock price and yesterday's exponential moving average. When the exponential moving average is calculated in this way, the MACD and its auxiliary indicators are obtained as follows.
MACD = EMA(12) - EMA(26)
MACD signal = EMA(MACD, 9)
MACD Oscillator = MACD - MACD signal
MACD is the short-term average minus the long-term average. If the MACD is positive, it can be intuitively understood that the stock price is on the rise. It is more convenient when creating trading logic with a program because it is expressed as a single number rather than looking at two moving average lines. The MACD signal and MACD Oscillator are the sub-indicators of the sub-indicator, which is to average the already calculated average again. Gerald Appel explained that if the MACD line and the MACD signal intersect, it means a trend change. To make it easier, the MACD Oscillator was made. A positive MACD Oscillator means buy signal and negative means sell.