How to read the signal

how to read trading signal
  1. Trading span: Swing or Day trade.
    • Swing: Hold for some days. It can be extended to some weeks according to the market situation.
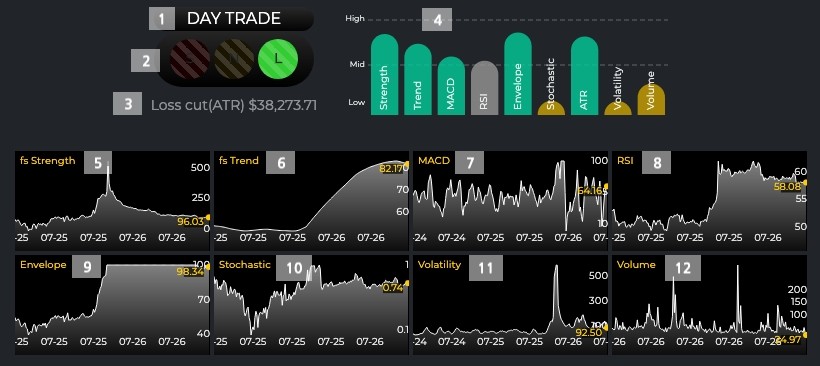
    • Day trading: Buy and sell within a day.
  2. Trading signal: Green, Yellow, Red.
    • Green: Buy and hold
    • Yellow: Sell out and wait
    • Red: Short sell
  3. Loss cut price, calculated with ATR indicator.
    • Loss cut price is calculated as "(Current price) - 2 * ATR"
  4. Current scores of each indicators.
    • The signal is decided by combination of multiple indicators. This chart shows current scores of indicators that are considered when calculating the trading signal.
    • The higher, the better.
    • The explanations of each indicator will be followed.
  5. fs Strength
    • fs Strength stands for the strength of price movement for the trade span.
    • fs Strength is calculated using complicated trend analysis methodology created by finterstellar®.
  6. fs Trend
    • fs Trend stands for the trend of price movement for the trade span.
    • fs Trend is calculated using complicated trend analysis methodology created by finterstellar®.
  7. MACD
    • MACD indicates how much the current price is overvalued or undervalued comparing to the average price during the trade span.
    • MACD is a famous price indicator that is widely accepted among stock investors.
    • Click to read more
  8. RSI
    • RSI indicates the price strength over the trade span.
    • RSI is one of the most popular price indicators, and commonly used by many stock investors.
    • Click to read more
  9. Envelope
    • Envelope indicates the price level compared to the average price over the trade span.
    • Envelope is simple but trustworthy indicator for chart base traders.
  10. Stochastic
    • Stochastic indicates the price level compared to the highest and lowes price over the trade span.
    • Click to read more
  11. Volatility score
    • Volatility stands for how much the price is fluctuating during the trade span.
    • Volatility score is calculated based on ATR indicator.
  12. Volume score
    • Volume score stands for how popular the coin is.
    • Volume score doesn't indicate the price strength directly, but implies short term price movements.
    • In many cases, increasing volume results in pumping for the short term.


For informational purpose only.